Showing posts with label IT's. Show all posts

Monday, 20 July 2015

Farewell?

Hi. I suppose not many people follow this blog but I want to say bye for now as I've finished my IT lessons at high school. And next year I have to get ready for selectivity so I won't have much  time, but I've enjoyed a lot this subject and I love having this blog, so I will try to keep on posting something from time to time. So no, this is not a farewell, just a 'see you soon'.

But now this course has finished, I don't have much to tell and it's summer holidays, time to rest, so have a great summer, and see you soon.

Carmen <3

Sunday, 14 June 2015

App Inventor

Hello again! We've started working with App Inventor. This is a software to create and programme an Apk (mobile application). You can design and create the functions of the Apk, and try it in your mobile phone (via Wifi or USB wire), or with a computer emulator, to check if it works properly. 

To access this program you just need a google account with which you log in in the MIT App Inventor webpage. Then you'll be asked the way you want to see the application on real time. You choose it or continue without emulation.

In the main page (designer) you can choose the components from the left column and drag them to the screen in the middle. Here you just place the components of the apk and select their features in the column in the right, as you like. There are many different components, but the most important ones are the buttons, which you can press to make actions, the canvas to add images, the labels to add texts, and other not visible components like the camera or the accelerometer, which act depending on how you programme them.

In the programming page (blocks) you create the 'orders' of the apk, depending on what you want it to do. On the left you can see the different features. If you want some specific component you added in the designer to do any action, you click on its name and select the action you want. You have to combine those 'orders' or blocks in a way it makes sense and works. As I said, you can check if it works with an emulator or with your own mobile phone. As you practice you will manipulate App Inventor better, so don't get desperate at the beginning.

We've had to create two apps. The first one is a photo painter. You can take a picture or take it from your gallery, and paint on it with different colors. You can download it to try it here.

The second one is a questioning game. You are asked a question and you have to answer it. Depending on how you answer it will congratulate you or you will have to try again. I already have to finish and improve it, but you can download it here.

I hope you liked, I think this is very entertaining if you like computing, so I encourage you to try it.

On the other hand this may be the last post about my IT lessons, because this is the last year I can have this subject and the course is finishing, but I will try to post something from time to time. Have a great summer.

Access

Hello again Internet surfers. We are working now with Access, a database management system owned by Microsoft Office, with its relational and graphical tools, and so similar to any Microsoft Office Software. It is used to create any kind of databases, in my case I made a database for a summer camp for anyone interested. It stores the information about the clients, the activities, the age groups, the monitors and the application forms. I'm going to explain you a bit how we've made it and show mine in some screenshots.


First of all we had to create some charts in which we included the information. The clients' and the monitors' charts included their personal data (name, surname, id, address, phone number, email...); the activities' one, the name of the activities, the description and the places where they are hold; the groups' one, the age gaps in which groups are separated, and the application forms' one collects the information of each client's application form, their choices, their allocated monitor and date, their personal data...

In the two first images you can see the main components of these charts.

Secondly we created the forms, which record that information from the charts and allow to add information. You can add them by clicking on "Form" in the window "Create". They can be personalised with different shapes and colors. Buttons linked to other forms or reports can be added, and also dropdown lists to choose the different options from a chart without having to write it oneself.

Then we also added reports for some of the forms. The most important one is the applications' one, because there the information about each client's stay in the camp is collected. It's easy to create because you just have to click on "Create -> Report" when you are on the chart of which you want to create the report, and it appears. You just have to adjust the design if you want to.

A last thing was the consultation. It's a sheet to consult specific information from a Form. You can choose what it will show when you create it with the assistent of consultations. You just follow the instructions and, if you want, adjust the design.

An important thing is the main menu, which has to be done to access everything from the database. Mainly the forms and the important reports, and maybe a print button for a report or an exit button. This can be made adding buttons in the form's tools window, and choosing its characteristics.

Some relationships between forms can be made to ease these things in the database's tools window, and also some other consultations. There are a lot of tools in Access, but the ones we learned are the basic ones, and anyone can manage with them.

I hope you liked and it was useful, see you in the next post (it will be interesting, about App Inventor, so have a look at it).

Databases

Hello! I'm going to write about databases. A database (DB) is a 'bank' of information which classifies the data and creates relationships between the groups of data. This information is organised in a way that the desired pieces of data can be quickly selected, found and accessed. It is also an electronic filling system, as you can add information whenever you want to. If it is properly designed, it can ease administrative works a lot. For example, if you have an enterprise and you want to clasify your products, have the information about their prices, the clients or the dates of delivery... Databases can collect small pieces of information, for small things (like personal things) as well as huge pieces information for huge enterprises or managements.

Traditional databases are organized by fields, records, and files. A field is a single piece of information; a record is one complete set of fields; and a file is a collection of records. For example: a telephone book is a file with a list of records, consisted of three fields: name, address, and telephone number.

On the other hand, data in databases can normally be reorganized and accessed in a number of different ways. They have charts in which the fields are specified and the data and the kind of information they contain is also added; forms in which the data can be seen in an organised way and also new data can be added in the different fields; reports in which the recorded information can be seen in a glance; and consultations in which some specific information is ordered and seen in an specific way, also in a glance, like reports but more specific. Relationships between charts and their fields are made to ease the results of the forms and the components of the database.

Databases are accessed and edited through Database Management Systems (DBMS), like Access, the one we normally use, which belongs to Microsoft. They enable you to enter, organize, and select data once the database has been created and molded for its target.

Once you know what a database is you can create one to organise some information. You'll see my database project in Access in the next post. Have a nice day, and enjoy the good weather.

Sunday, 10 May 2015

Servomotors

Hello in this third term. I have to write something about servomotors.

A servomotor is a rotary actuator which receives electric signals or orders and rotates with precise control of angular position, velocity and acceleration. It consists of a motor joined to a sensor for position feedback. It also requires a sophisticated controller.

In our case we controlled it through the Arduino software, and connected the servomotor to the Arduino board to make it recieve the orders. Once it has recieved the data from the computer, the board stores the information and makes it work when it receives an specific signal from the sensors. Then it turns the determined number of degrees in an specific direction, speed and strength, depending on what signal it receives and what you've programmed with the software.

We've been using these motors to make some Arduino robots work. Ours consisted on a rocking chair-robot which had a foil heart which, when being touched, activated those servomotors and lifted the arms and the legs. This was possible because the board received a signal from the capacitive sensor (the foil), which receives current from our skin, and then activated the servomotor, which rotated some degrees and pulled a piece of thread which was attached to it and to the arms and the legs, and with the pulley effect, those were lifted. It was hard to attach the thread to the servomotor and the lifts, and make the capacitive sensor work, but we finally made it and it was cool.


I hope you liked, see you in the next post!

Monday, 23 March 2015

Arduino

To end this term we've been working with Arduino. Arduino is an open-source electronics platform based on easy-to-use hardware and software. It's intended for anyone making interactive projects and it's mainly composed by a software and a board shield, supplemented by several means. This project was created in around 2005 by a group of people related with the Italian Interactive Design Institute Ivrea, to create a more affordable and accessible free hardware device, compatible with most operative systems. Now there are discussions about the licensing of Arduino between its creators but this project is a great mean for education and development so I hope we will still be using it in schools for long.

In our high school we have several Arduino materials with which we create interactive gadgets. Then with our creations we participate in a technology fair. But, to get started on it, we at first make simple projects. We've made two projects until now. You can see the information about them in the Verkstad Creative Technologies webpage, in the second and third blocks.

The first project consisted on a sport or game. My group made REACT. It consists on a sequence of LEDs that come on light aleatory and you have to push the corresponding capacitive sensor rapidly to continue playing. You can see the information here:


The second project consisted on a "magic" gadget. My group made POV, which consists on a line of LEDs on the shield which come on light depending on how you program them, so that when you make it turn rapidly or you move it rapidly, you can see words or symbols on it, and it is so cool. You can see its information here:


I hope you liked, I'll upload more information and images about this if we continue working with Arduino. Have nice Easter holidays!

Processing

Hello again. We've started programming in computing with Processing and Arduino. Processing is an open source programming language and integrated development environment (IDE) to create designs and electronic or media art. For example, you can create figures which follow the mouse, stay the same, move aleatory or through your keyboard's keys, or follow orders, with different colors and shapes, and make them do something interesting.

We worked with the exercises from the Creative Technologies web, and then modified them, so in the 1st block from this webpage you can find the explanations about these exercises and how to do them.


To set the size of the window that appears we use the function void setup(). Data is inserted between {} and each line with data ends with ; .

A first exercise useful to learn is creating a figure with different shapes, sizes and colours, and place them in a coordinate or make them follow the mouse. The properties of these figures and the background colours are set with the function void draw()

Another simple exercise to learn is creating a line whose end follows the mouse and leaves a trail through his way, by making one of its ends follow the mouse with the coordinates line(0, 0, mouseX, mouseY).

Then we also made a kind of snake which follows the mouse and changes colour through the time. I changed its shape, the colours, the time in which it changes colour...

A more complicated practice was making a digital clock which was based on the computers' clock. We inserted the numbers' images, changed the shape of the clock, put it horizontally and added the colons.
To finish with Processing we made a videogame in which something moved with the keyboard keys had to catch a falling object. I set all the images, changed the time limit, set a winning objective and adjusted several things.

Programming is complicated if you have to do it from scratch, but with Versktad's webpage it's a lot easier, it explains it very well and you can manage to change already existent programs.

I hope it was useful and you liked it, in the next post I'll write about Arduino.

Golden Ratio in design

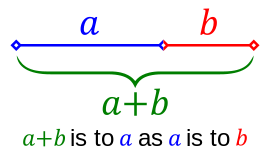
We've been asked to write something about the Golden Ratio in design. This amazing term is the one which appoints the proportion between two quantities when their ratio is the same as the ratio of their sum to the larger of the two quantities, and you can see it better in this image:


This ratio can be obtained from the division between two consecutive numbers from the Fibonacci progression (Fibonacci or Leonardo of Pisa was an Italian mathematician from the XII and XIII centuries), whose numbers are obtained through the addition of the two previous numbers of the succession (1,1,2,3,5,8,13,21,34,55,89,144...). This division has a result of roughly 1.618.
Golden Ratio in nature

This ratio appears naturally in several aspects of nature as the position of some plants' leafs or petals, the shape of shells, galaxies, reproduction of rabbits... Even the entire human form may be broken down into a series of Golden Ratios.

But, appart from that, many designs are based on the Golden Ratio, as it is considered as a beautiful proportion to see. Some examples are the shapes of credit cards, postcards, playing cards, posters, wide-screen televisions, photographs, light switch plates and cars, webpages, and many brands' logos. There are also even hisatorical art samples which show the Golden Ratio, such as portraits, paintings, buildings, sculptures...Some of these historical samples are the Athens Parthenon, the Mona Lisa, the Vitruvian Man, and many other paintings, sculptures and buildings, as a result of trying to create beauty.


According to more actual designs, for instance, most apple designs are based on the Golden Ratio, as their logo, the iCloud logo or their mobile phones. Something we use daily as our credit cards or identity cards have the Golden Ratio on them. Also the logos of National Geographic, Toyota, Pepsi, BP, Grupo Boticario, Twitter, and also the Twitter main webpage, but surely many more have this ratio. You can see these examples here.

To sum up, the Golden Ratio or Fibonacci number is something which surrounds us naturally or artificially, that makes us see things beautiful. It may appear by chance or be really studied by designers, but it's on many things we see, and realizing and learning about it is amazing.

I hope you liked and learned a bit about this wonderful ratio. I'll write the next post soon, see you.

Saturday, 7 February 2015

Alan Turing

Hello again. We've been told to post something about Alan Turing, who was a British pioneering computer scientist, mathematician, logician, cryptanalyst, philosopher, mathematical biologist, and marathon and ultra distance runner. 

Alan Turing, considered father of modern computing, was born in 1912 and he was homosexual. That's why he is supposed to have killed himself ingesting cyanide in 1954, because that time homosexuality was punished (he was chemically castrated and condemned for 61 years). He's recently been reprieved by Isabel Queen.

He influenced the end of the second world war because he cracked the "unbreakable" nazi code Enigma through his electromechanical machine, which is considered as a precursor for modern computers. This machine made a set of logical deductions for any possible combination.

Another important thing he did is create the first detailed design of an ACE (Automatic Computing Engine), a computer of programmed storage. Analising this and wondering whether a computer could compose music or think, he made an experiment, the Turing Test, which considered a machine "smart" when a person was unable to distinguish computers' answers from real persons' answers. Nowadays we know the CAPTCHA, which is the reverse of Turing test.

He also made a chess programme, studied the Fibonacci numbers in nature, worked in cybernetics and started programming, for instance, so he was a great man with a sad ending.

In brief, Alan Turing made great progress in computing and science in general, and maybe, if it weren't for him, we wouldn't have all these smart gadgets or be so computing-developped.

I hope you learned a bit more with this post, have a great day.

Friday, 12 December 2014

Excel III: Customizable laptop app

Hello for the last time in this term. The last excel practice we've made consists on an application to make a laptop with the components you choose, which gives you a budget and the possibility to adjust a price limit.
The first sheet is a front page with linking buttons to the rest of the sheets, as always.

The components' sheet is a simple one but it takes some time and it's such a tedious work because you have to look for information of laptops' components and their prices. The only remarkable thing here is the format of the price cells, in euros, and the linking buttons to the other sheets.

The invoice sheet is very complex. For the price of each component I set a "VLOOKUP" function, which I explained in the post about the automatic invoice, with this code: =BUSCARV(C4;Componentes!B2:C13;2;FALSO). To make a dropdown list for each component I used a data format called data validation, as a list, taking the data from the respective chart from the components' sheet. For the final price I added all the components' prices and then I added the 21% of taxes as you can see in the image. And as alert I added an 'IF' function which warns you if the final price exceeds your personal price limit, and which is =SI(C14=0;"";SI(D17>C14;"CUIDADO, ¡SUPERADO!";"NO SUPERADO AÚN"))
To make it become red I added a conditional format only applied to cells with the specific text that is shown when the personal limit price is exceeded. But to alert you in a greater way I also added an error message through another data validation in the price limit cell. Here you have to make possible only a lower final price amount than the price limit amount, as the image below shows, and set your own error message.


I hope it was useful, you can always ask me anything in case of doubt. Have a great Christmas time and enjoy yourselves on this holydays!

Friday, 5 December 2014

Excel II: Ecuation solver

Hello again. The second big project we've made with excel is an ecuation solver which can solve simple ecuations of first degree and of second degree quickly.

In the first sheet there must be a front sheet that links to the rest of the sheets: 1st degree ecuation, representation of the 1st degree ecuation, 2nd degree ecuation and representation of the 2nd degree ecuation. You can do it with a macro or with a hyperlink as the image shows.

For the first degree ecuation I just had to write the ecuation leaving gaps where each term had to be written and leave a solution gap where I wrote the formula to solve the ecuation. I also made it notify if there were terms left. So my function was =SI(D7=0;SI(F7=0;"¡Faltan coeficientes en la ecuación!";"¡Faltan coeficientes en la ecuación!");(H7-F7)/D7). I solved the ecuation leaving the x alone.
For its representation I wrote the formula as in the previous sheet and gave several values for the x in a chart and, to obtain the respective value of y, I just made a formula replacing x by the value given respectively: =SI(C10=" ";" ";$D$5*C10+$F$5-$H$5). To add the graphic you insert a lines graphic and set the data as the image shows. I also added linking buttons as in all the sheets.

And for the second degree ecuation it's the same but with a different formula: =SI(D7=0;SI(F7=0;SI(H7=0;"¡Faltan coeficientes en la ecuación!";"Ecuación incompatible");"Ecuación de primer grado");SI((F7^2-4*D7*H7)>=0;((-F7+(RAIZ(F7^2-4*D7*H7)))/(2*D7));"Sin resultados reales")) for the first result and: =SI(D7=0;SI(F7=0;SI(H7=0;"¡Faltan coeficientes en la ecuación!";"Ecuación incompatible");"Sólo hay un resultado");SI((F7^2-4*D7*H7)>=0;((-F7-(RAIZ(F7^2-4*D7*H7)))/(2*D7));"Sin resultados reales")) for the second result. 

To make its representation it's the same, replace the x by different values to obtain the y, and create the graphic with that values. The formula I used was: =SI(C10="";"";$D$5*(C10^2)+$F$5*C10+$H$5)

I made erase and print buttons with macros in each sheet so, if you want to know how I did them, visit my previous post. I also added linking buttons in each sheet to link to the rest of the sheets.

I hope it was useful and if you've any questions, please ask me. See you.

Wednesday, 15 October 2014

Internet of things

As in the project about the knowledge society I didn't expand much the concept of Internet of things, I'm going to devote this post to it.


The Internet of things (IoT) is the term we use to call the fact of having our gadgets and the things that surround us digitally controlled and interconnected through the net. This includes alarm systems, cell phones, printers, washing machines, coffee makers, blinds, headphones, lamps, wearable gadgets, machines components... And almost anything else you can imagine, so it's a huge network of connected devices and also people, which allows relationships betwen both groups.

It has the potential to impact how we live and work because of the great advances of the new technologies: broadband Internet availability, easy connection, new very capable devices, a great smart phone penetration, the decreasing technology costs... And in a short period of time we might be able to say that anything we want to be connected and controlled can be connected and controlled, and we'll live in smart cities and smart houses which interact with us.

For example we can change the temperature or the illumination of our house with a smartphone depending in our feelings, blinds can come down automatically when it's very sunny or at night; the trafic lights can control themselves depending on the traffic and the people waiting to cross the road...

So anything can be done automatically with IoT so life will be a lot easier as this is developped, locations will be known easily, economy would be more controlled, education will develop, what's turned on or off will be known, anything will be close to everyone even if it's on the other side of the world... And we should make this possible.

I wish you agree and you liked, I obtained some of this information at this webpage: http://www.forbes.com/sites/jacobmorgan/2014/05/13/simple-explanation-internet-things-that-anyone-can-understand/

See you!

Wednesday, 8 October 2014

Knowledge Society

Hi blog readers. The first project we had to do this course was a Word document about the knowledge society. In it we talk about what the concept of knowledge society involves, its characteristics and its background. This society is a progression from the information and communication society that also allows the management of the information skillfully.
I also speak about the areas in which it is important; our personal development and the social factor that makes us being interconnected and learn dynamically.
Other important factors are the problems that it may suppose with the use of technological devices (the Digital Divide, the cybercrime and other security problems) and I have to tell you to be careful with what you post or upload on the Internet and to control the time you spend on the net and valore if you are really taking advantage of the resources and the time you have in a good way.

Sociedad del conocimiento from Carmen Bueno Iglesias

I wish it was interesting and you liked, you can also watch the document here. Thank you for watching.

See you at the next post.

Tuesday, 23 September 2014

Welcome again!

Hello everybody, how has your summer been? We've come back from holidays and we're going to start a new Computing course. This course the subjet isn't called Computing but IT (TIC in spanish), and now we don't have the bilingüal classes option so we take them on spanish, but I'll try to continue writting in English.

This summer I've made some interesting things; I've been to a 3D computer design workshop using 3ds Max and I've made a 3D Pocahontas, I've recieved a graphics tablet to draw and design on the computer and I've been drawing with it, I've made a poster for a contest in my village through Corel Painter X3 and I've won...
But now the new course is starting and we're going to do a lot of interesting things too.

I'll be reporting you about our learning during the course with several posts, as I used to do last course, so I wish you like my blog and my new posts, see you in the next one.

Sunday, 15 June 2014

VideoPad

These last days of the evaluation we are making a video with VideoPad.

VideoPad is a video edition tool, which was created in 2008 by NCH Software.

The first thing you have to do to start a video or edit it, is adding files (videos, images, sounds), by clicking the Add Media icon on the tasks bar above. Then you can cut the video or adjust its length with the icons under it and add it to the video line below, where you can see the 'perspective' of your video (how is it assembled).
Once you've set all the videos, images or sounds you want on the video line, you can add effects, transitions or overlays on or between each of them through the icons on the tasks bar.
Afterwards, you can subtitle the movie with the corresponding icon of the tasks bar, and finally you have to export it; save it as a video.
  
Obviously, as you get used to using it you will understand it better and you might find some new actions to edit your videos. It's a good basic tool with a free trialware for you to try it and if you like computing you will enjoy it.
I wish you liked, as always, and currently this is the last post of the evaluation but I'll try to continue informing you whenever I discover something interesting. See you :)

Saturday, 14 June 2014

How to disappear from the Internet

Hi everyone. This term I have to report you about something that may concern you some day: deleting your identity from the net. This can be useful if there's any data or document about you that you don't want to be there.

The first thing you should do is the most evident one: deactivating accounts you know you have. If you search the account settings in a social network or webpage you may find easily the deactivate, delete or close account button. But there are some accounts you may have forgotten you have, so the next thing to do is to search for yourself at the searchers. You will be more assured if you do it through different searchers because some of them may not show everything you have on the Internet. Then you deactivate or delete the things you find. The e-mail can be a very useful tool if you don't remember a password but, if you definetely can't delete something, you can always try to falsify it. Remember to be respectful and don't set anything improper.

That could be enough, but there might be some loose ends. Make sure you aren't suscribed to any mailing list such as from newsletters, ads or promotions and if you are, unsubscribe from there; delete searchers' results about you, through a removal tool they may offer or by contacting webmasters; ask companies from which you are a member to delete your information they have listed online and, in the end and as a drastic resource, delete your e-mail, close your account in it. With this actions you could start rewriting your identity and your dignity on the Internet from scratch.

An example of aim of forgetfulness on the Internet is the one about a spanish man who won the battle to Google defending his "right to be forgotten", with whom the Court of Justice of the European Union (ECJ) agreed. So what's more important, the right to the privacy or the right to the the expression freedom? Difficult cuestion. Anyway Google can be required to remove data so you can be safe.

I wish you never need this but take advantage of it if you do.
See you soon, because I have to post something else before classes finish. What will it be? You'll see tomorrow :)

Wednesday, 28 May 2014

Computing Security


Although we are entering the last weeks of class and we have a lot of hard work, I'm getting advantage of some spare times to write a new post. Some time ago we were told to prepare a report about computing security, approaching different aspects of security on our devices and software. 
I upload here the Word document I've made. In it I define Computing Security and I talk about the different types of Computing Security, which are human, physical and logical security.
Then I also explain what malware is; malicious software that damage something in computing. I explain their types and the options to protect us from them, like the use of antimalware and the awareness of dangers on the Internet. I've also added the information from the previous post and some tips to communicate through the Internet.
It's a broad theme and here you have an -I think- useful summary of the things I found basical, interesting and easy to understand.
I wish you like it and see you at the next post, if I survive to these last weeks.

Computing Security from Carmen Bueno Iglesias

You can also watch it here.

Sunday, 27 April 2014

Internet Security

Hello again, I share a new post with you today to explain a bit about security on the Internet. We don't realize but we're surrounded by possible dangers that may harm us or involve us in crimes. We can find two main possible dangers related to Internet connection:

# Accessing fake Wi-Fies
When you are in a public place you will often find some free Wi-Fi. Well, it's sometimes a wifi from the specific place but it's sometimes a fake created by someone to catch your information, and depending on the information you have compiled in your Internet connexion, the hacker can access your accounts, watch and use your media files, supplant your identity... And it can be very dangerous for you, so be careful and try not to connect WiFies which are completely opened or which look suspicious.

# Leaving your WiFi connexion neglected, without enough security
It's not much problem if someone catches your WiFi password to use the Internet sometime, but it'll be a big problem if they use it to commit a crime or access your information as in the previous case. In our routers we usually have WEP (Wired Equivalent Privacy) encryption codes, which are weak and easily decoded, and worse if we don't change the default codes. If you want to be safer, at least you should have WPA (Wi-Fi Protected Wireless), whose algorithm is stronger. But the safer and difficultly decoded encryption protocols are WPA2, with Advanced Encription Standard. Whatever you have, try to make it secure, change the name and the password, hide any weak point...

I wish it was useful and you liked, see you next post, as always ;)